"To get you started, we’ve put together some videos showcasing how our BI dashboards can empower your battery research. If you have any feedback or would like a personalized virtual demo, please feel free to reach out. Thanks!"
Introduce our Battery Manufacturing Dashboard – a powerful BI (Business Intelligence) tool designed to provide in-depth insights into the distribution and expansion of production capacities within the EV(Electric Vehicle) and ESS (Energy Storage System) battery industry, along with their upstream component materials. This dashboard not only maps the geographical locations of production facilities, but also highlights the key stakeholders driving these technological advancements.
The dashboard is responsive across various screen sizes, allowing you to access analyses from your computer, tablet, or mobile phone. Additionally, you can toggle between dark and light themes based on your preference.
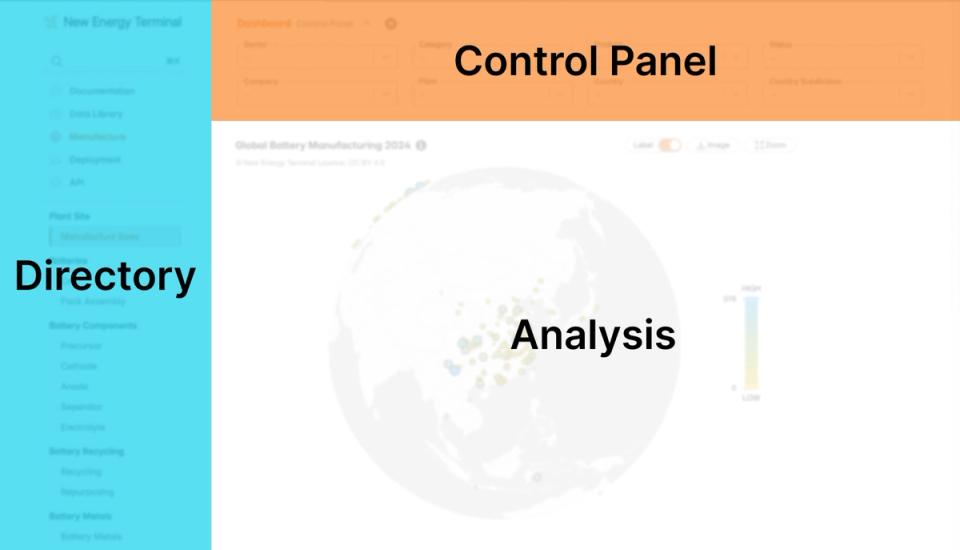
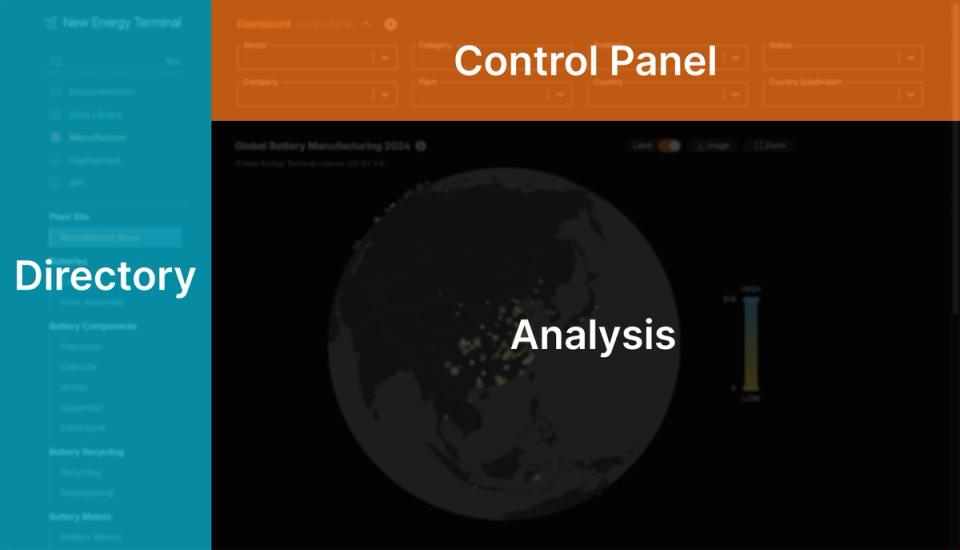
Let’s start with the Plant Site Dashboard, which provides a comprehensive overview of battery and component manufacturing locations. This dashboard consists of three key areas: the data directory, control panel, and the analysis.
"Please be aware that the data presented in this demo is derived from incomplete statistics and may not accurately reflect the current market status."
I. Data directory
The sidebar lists a subset of the available sector-wise analyses. Currently, it is grouped into manufacturing and deployment, focusing on EV and stationary battery manufacturing and related stakeholders. (We plan to give more attention to renewable energy deployment analysis in the future.)
II. Control panel
Here, you can adjust input parameters to customize the output. For instance, you can select “cell” in the category dropdown menu if you’re only interested in battery cell-related statistics. To see a specific manufacturer’s production breakdown or compare multiple manufacturers, you can specify those details accordingly.
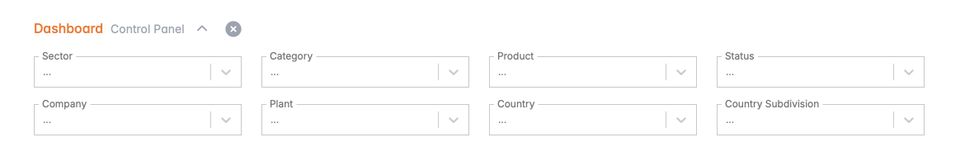
Important: The selection of certain parameters is sequentially dependent on prior choices, as outlined below:
- Sector > Category > Product
- Top Company > Plant Operator
- Country > Administrative Subdivision
Hint: You can hide the control panel by hitting the “⌃” icon.
III. Analysis
Unlock more insights with our Battery Manufacturing Dashboard:
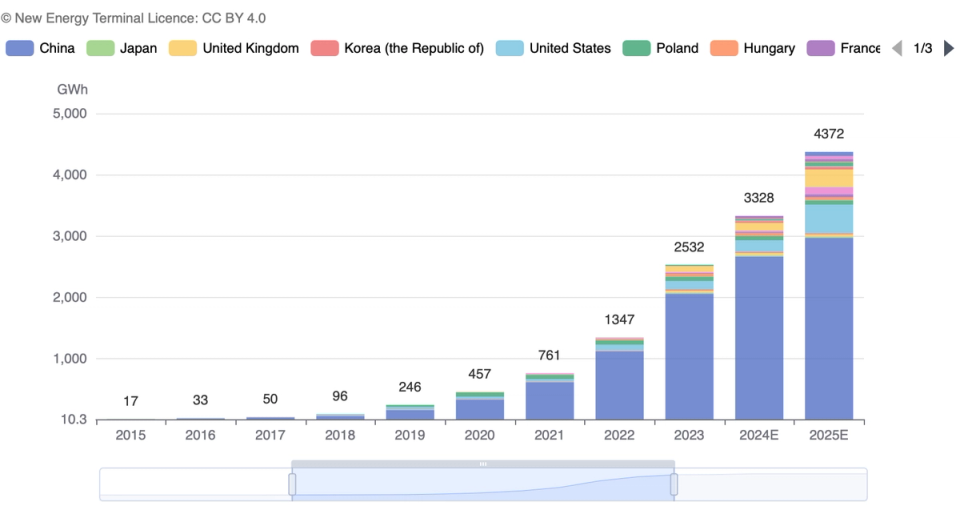
Industry layout
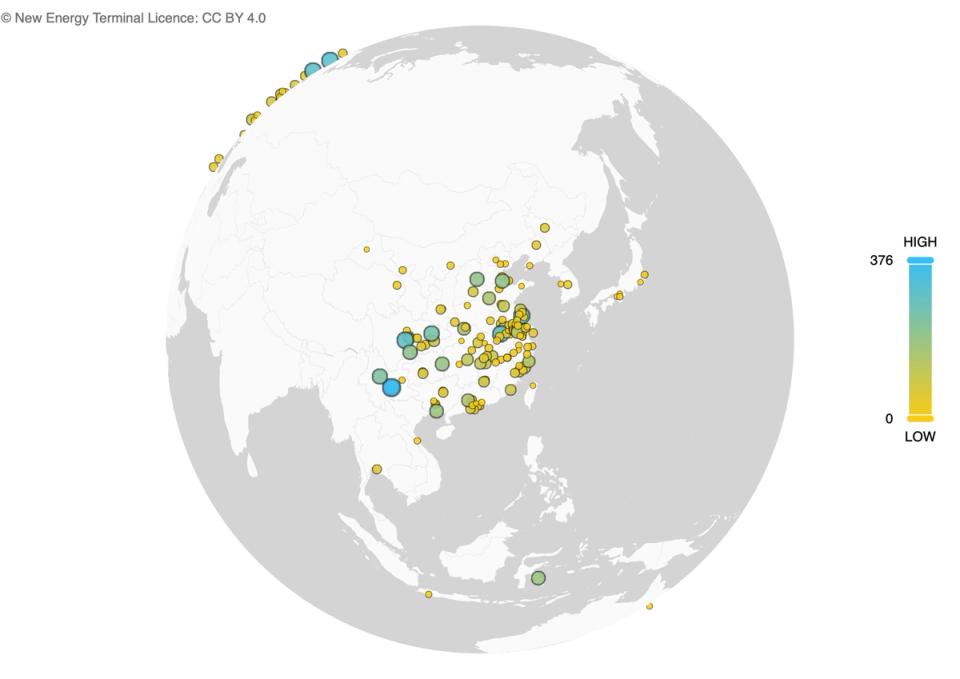
Production capacity planning
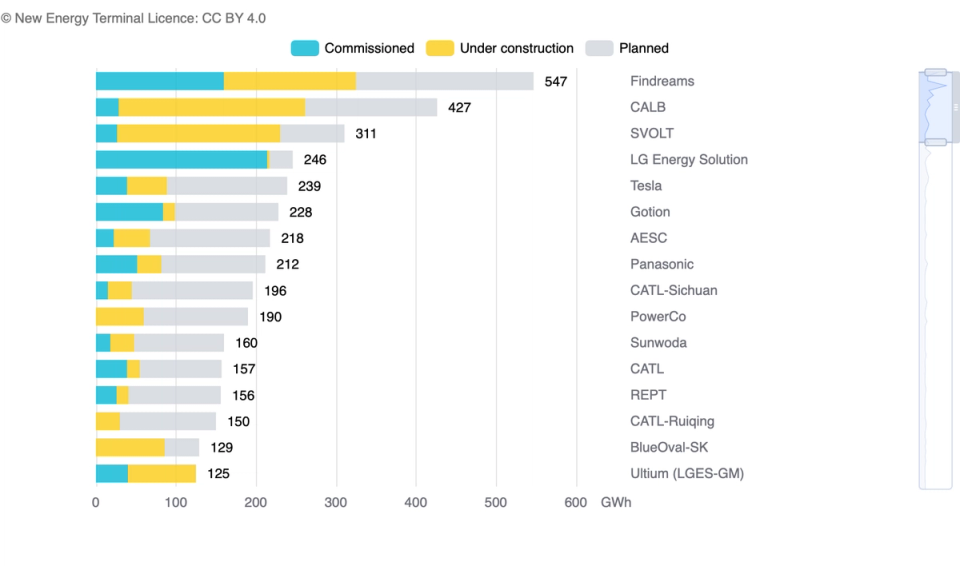
Manufacturing statues
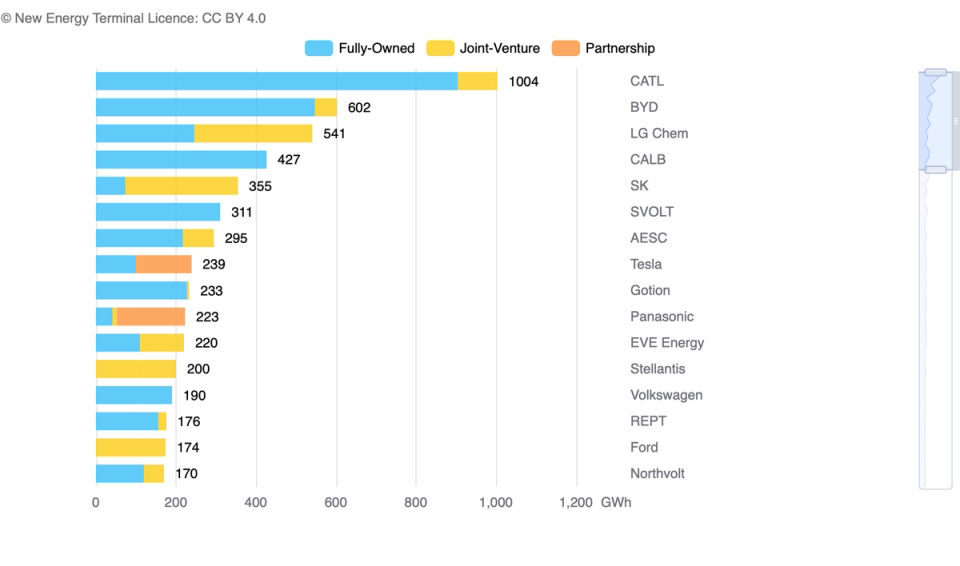
Ownership structure
Hint: The data toolkit area, located next to the chart title, includes buttons to download data, toggle dimensions, save results as images, or zoom in on the view.

Data library
To monitor individual production sites, utilize our Data Library, which catalogs information on hundreds of manufacturing plants. Additionally, explore company profiles for related manufacturers to gain deeper insights, such as business segmentation and organizational structures. Accessing these resources is straightforward: navigate through the Data Library, or take advantage of the convenient hyperlinks embedded within the Plant Site Dashboard.


Feedback ❤️
As technology advances, we might experience significant changes in how we identify information, categorize data, and present the analyses. We’re excited about these innovations and will keep you updated.
If anything is unclear or requires further explanation, or if you have suggestions or spotted any errors, please feel free to reach out. Thank you!